
During the development phase of a Data Intensive Application (DIA) using Big data frameworks (such as Storm, Spark, etc.) developers have to contend with not only developing their application but also with the underlying platforms. During the initial stages of development bugs and performance issues are almost unavoidable and most of the time hard to debug using only the monitoring data. The anomaly detection platform is geared towards automatically checking for performance related contextual anomalies.
The context is given by the performance metrics at any given timestamp (i.e. index). Initially the developers can use the entire available context given by the monitoring data to check for anomalies. During later stages of development predictive models geared towards identifying particular anomalies can be trained on all major builds of a DIA. This will enable developers to check for any anomalies stemming from the modification made from one version to another.
Detecting anomalies is a complex task which is made even more difficult when we think that performance anomalies by their very nature are scares in the sense that usually less than 1% of all performance metrics will show or cause an anomaly. This massive imbalance in the available data is very hard to take into consideration. Because of this the anomaly detection tool is able to not only automatically distinguish between numerical and categorical features and re-encode them but also has the ability to tune the performance of the selected detection method. For example, if we want to use Random Forest to create a predictive model the parameters of this method have to be tuned to the idiosyncrasies of the particular DIA. We can accomplish this by using the hyper parameter optimization methods integrated into the anomaly detection framework: Grid Search and Random Search.
The anomaly detection tool is also able to export several important reports which aid in fine tuning the predictive power of the selected methods. Let us consider that we chose to use the Random Forest algorithm. What are the features that impact the predictive performance? In the case of our tool we can see the feature importance for all trained model (see Figure 1 for an example).
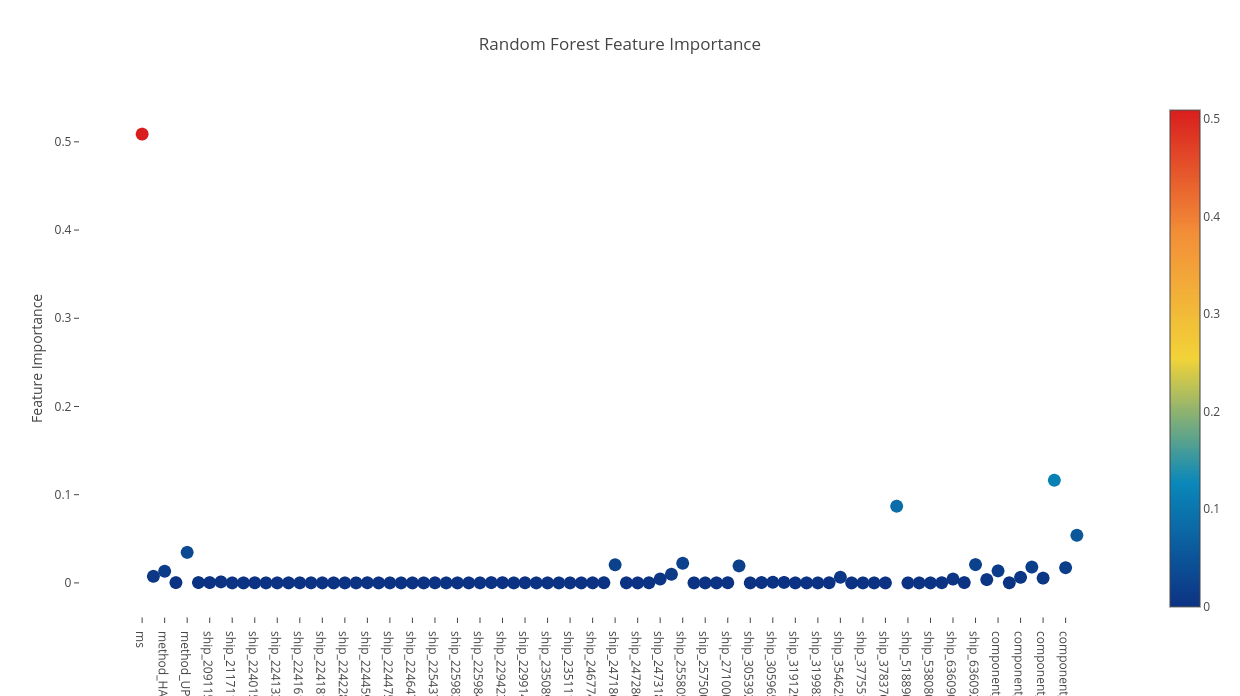
Figure 1: Feature Importance for CEP Usecase.
This information is useful in the sense that it can identify what performance metrics are relevant for successfully identifying an anomaly. Also, it can be used to eliminate those features (performance metric) which have little to no impact on the predictive performance of the trained model. These features can then be dropped thus reducing the computational requirement for training a mode.
Training and validating the predictive models is also of vital importance. Because of this the anomaly detection tool uses KFold cross validation. This ensures the best possible out of sample performance. Figure 2 illustrates how, during simple training without validation the resulting model can have a 100% prediction rate however, in fact it has overfitted quite badly. Although the cross validation score is much lower it in fact produces a much better performance in real world scenarios.
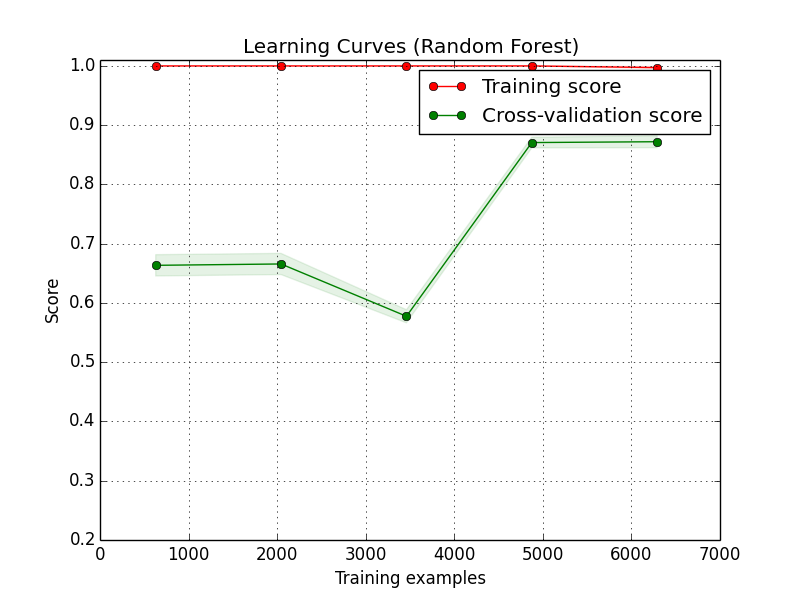
Figure 2: Cross-validation vs Training.
The anomaly detection tool is able to show not only the presence of anomalous events but also the performance of its predictive models. This enables developers not only in tweaking their DIA but also in fine tuning the anomaly detection methods.
Validation
The anomaly detection tool has been applied during the development phases of Posidonia Operations Use Case. Posidonia Operations is an integrated port operations management system. Its mission consists on “glocally” monitor vessels positions in real time to improve and automatize port authority’s operations. Its functionality is based on analysing a real-time stream of messages that represent vessels positions to detect and emit events that occur on the real world (a berthing, an anchorage, a bunkering, etc.). One of the software components is the CEP, Complex Event Processing, engine which analyse al the messages in order to detect patterns and create the corresponding events. One of the types of requirements of the Posidonia Operations use case is the Assessment of the impact in performance after changes in software or conditions.
The anomaly detection tool has been validated to detect anomalies related with the cost execution time of the different events that the CEP component analyses, this cost impact directly in the performance of the system.
Methodology
First of all, we studied the log file generated by the CEP component (see Table 1 as an example of the log file). The “component” column represents the type of rule, the “key” column represents the timestamp, the “method” column represents the function called, the “ms” represents the time need to evaluate the rule and the “ship” column represent the identification of the vessels. We observed that each type or rule analysed has a similar execution cost (column “ms”). After that, we defined what could be an anomaly, considering the execution cost for each type of rule. Finally, we use the anomaly detection tool to detect possible anomalies.
Table 1: Example of the Rules Execution Cost.
| component | key | method | ms | ship |
|---|---|---|---|---|
| AIS_SENTENCE_LISTENER | 2017-06-22T11:53:04.278Z | HANDLE_MESSAGE | 209 | 211636100 |
| SIMPLE_ANCHOR_OUT | 2017-06-22T11:53:04.272Z | UPDATE_ACTIVE | 710 | 305965000 |
| STOP_OVER_OUT | 2017-06-22T11:53:04.271Z | UPDATE_ACTIVE | 652 | 305965000 |
| SIMPLE_DOCK_STOP | 2017-06-22T11:53:04.270Z | UPDATE_ACTIVE | 293 | 305965000 |
| STOP_OVER_IN | 2017-06-22T11:53:04.270Z | UPDATE_ACTIVE | 680 | 305965000 |
| SIMPLE_DOCK_STOP | 2017-06-22T11:53:04.269Z | UPDATE_ACTIVE | 295 | 305965000 |
| AIS_SENTENCE_LISTENER | 2017-06-22T11:53:04.263Z | HANDLE_MESSAGE | 9483 | 305965000 |
| SIMPLE_ANCHOR_OUT | 2017-06-22T11:53:04.262Z | UPDATE_ACTIVE | 755 | 305965000 |
| STOP_OVER_OUT | 2017-06-22T11:53:04.261Z | UPDATE_ACTIVE | 618 | 305965000 |
| STOP_OVER_IN | 2017-06-22T11:53:04.260Z | UPDATE_ACTIVE | 686 | 305965000 |
| SIMPLE_DOCK_STOP | 2017-06-22T11:53:04.259Z | UPDATE_ACTIVE | 303 | 305965000 |
| AIS_SENTENCE_LISTENER | 2017-06-22T11:53:04.246Z | HANDLE_MESSAGE | 199 | 225366000 |
| AIS_SENTENCE_LISTENER | 2017-06-22T11:53:04.245Z | HANDLE_MESSAGE | 766 | 224161160 |
Table 2 contains the anomalies detected by the anomaly detection tool applying the method “Random Forest Classifier” to the data stored during the last 24 hours in the monitoring platform by the CEP component. The “key” column represents the timestamp of the event, the “ms” column represents the millisecond needed to evaluate the rule, the “ship” represents the identification of the vessels. The “target” column represents if there is an anomaly or not, in this case all the entries have the value “1” because only the anomalies are listed in the table. The rest of the columns represent the type of the event detected (value 1.0).
Table 2: Random Forest Classifier Results.
| key | ms | ship | AIS_ SENTENCE_ LISTENER | RETRACT_ OLD_ AISGEOMDATA | SIMPLE_ DOCK_ STOP | STOP_ OVER_ IN | STOP_ OVER_ OUT | HANDLE_ MESSAGE | RETRACT | UPDATE_ ACTIVE | target |
|---|---|---|---|---|---|---|---|---|---|---|---|
| 2017-06-22T11:52:59.273Z | 578303 | -1 | 0.0 | 1.0 | 0.0 | 0.0 | 0.0 | 0.0 | 1.0 | 0.0 | 1 |
| 2017-06-22T11:52:54.447Z | 38763 | 247186300 | 0.0 | 0.0 | 0.0 | 0.0 | 1.0 | 0.0 | 0.0 | 1.0 | 1 |
| 2017-06-22T11:52:59.415Z | 27897 | 636092485 | 1.0 | 0.0 | 0.0 | 0.0 | 0.0 | 1.0 | 0.0 | 0.0 | 1 |
| 2017-06-22T11:52:54.443Z | 4895 | 229423000 | 0.0 | 0.0 | 0.0 | 1.0 | 0.0 | 0.0 | 0.0 | 1.0 | 1 |
| 2017-06-22T11:52:54.445Z | 2320 | 247186300 | 0.0 | 0.0 | 1.0 | 0.0 | 0.0 | 0.0 | 0.0 | 1.0 | 1 |
| 2017-06-22T11:52:54.445Z | 2320 | 247186300 | 0.0 | 0.0 | 1.0 | 0.0 | 0.0 | 0.0 | 0.0 | 1.0 | 1 |
| 2017-06-22T11:52:55.002Z | 2270 | 247186300 | 0.0 | 0.0 | 1.0 | 0.0 | 0.0 | 0.0 | 0.0 | 1.0 | 1 |
| 2017-06-22T11:52:54.444Z | 2258 | 247186300 | 0.0 | 0.0 | 1.0 | 0.0 | 0.0 | 0.0 | 0.0 | 1.0 | 1 |
| 2017-06-22T11:52:55.003Z | 2181 | 247186300 | 0.0 | 0.0 | 1.0 | 0.0 | 0.0 | 0.0 | 0.0 | 1.0 | 1 |
| 2017-06-22T11:52:55.131Z | 2166 | 229423000 | 0.0 | 0.0 | 1.0 | 0.0 | 0.0 | 0.0 | 0.0 | 1.0 | 1 |
| 2017-06-22T11:52:55.124Z | 2067 | 247186300 | 0.0 | 0.0 | 1.0 | 0.0 | 0.0 | 0.0 | 0.0 | 1.0 | 1 |
| 2017-06-22T11:52:55.123Z | 2055 | 247186300 | 0.0 | 0.0 | 1.0 | 0.0 | 0.0 | 0.0 | 0.0 | 1.0 | 1 |
Experiment
To validate the use case, some anomaly detection methods have been used: AdaBoost, Decision Tree and Random Forest.
For supervised learning methods labelled anomalies from application data instances are a prerequisite. The data sets must be labelled to create a viable training and validating data set. Once this is done the resulting predictive models can be easily applied at runtime. We manually label a dataset comprising over 4800 data points taking into account the considerations of the Table 3.
Table 3: Anomaly Detection Experiments.
| Method | BScore | BTime | Param Search | CV Mean | CV STD | CV Time | FScore | FTime |
|---|---|---|---|---|---|---|---|---|
| RF | 0.68 | 0.061148882 | 185.4456398 | 99.98% | 0.05% | 27.50044012 | 1.0 | 4.573200941 |
| DT | 0.53 | 0.004851103 | 5.034779072 | 99.97% | 0.09% | 0.047837019 | 0.998913718 | 0.003602982 |
| AD | 0.51 | 0.235774994 | 62.63462806 | 100.00% | 0.00% | 0.415092945 | 1.0 | 0.05479002 |
| NN | 0.34 | 0.564079046 | 1771.0435 | 100.00% | 0.00% | 0.2695 | 1.0 | 0.03283 |
For validation purposes, we ran all supervised and unsupervised methods on this data set. We can see in the following table the results of the first validations. First, we ran a baseline where all methods had their parameters set to default values and saved both the score and the time it took to train a model (BScore, BTime). After that, we ran parameter optimization on all methods and executed a 10 fold cross validation with 30% of the dataset used for validation. We can see that the parameter optimization not only allow us to optimize the predictive performance but also the required training time (BScore and BTime for the baseline and FScore and FTime for the best performing).
An interesting observation which can be made using ADT is the so called feature importance. It is in fact showing what the impact of each feature from the data set has on the classification model. Table 4 shows the feature importance for the tree based classification methods. The Features column represent the name of the feature analysed and the columns AdaBoot, Decision Tree and Random Forest contain the impact of each feature in each method. The higher the number, the more important the feature. One surprising fact evident in the Table 4 is that although “ms” feature has quite an impact on the predictive model it is not the most representative.
Table 4: Feature Importance.
| Features | AdaBoost | Decision Tree | Random Forest |
|---|---|---|---|
| AIS_SENTENCE_LISTENER | 0.1 | 0.193142068 | 0.153848567 |
| RETRACT_OLD_AISGEOMDATA | 0.1 | 0.000700426 | 0.005668693 |
| SESSION | 0.1 | 0.00990615 | 0.032303538 |
| SIMPLE_ANCHOR_IN | 0.1 | 0.052707564 | 0.196569172 |
| SIMPLE_DOCK_START_OUT | 0.1 | 0.003373742 | 0.035556067 |
| SIMPLE_DOCK_STOP | 0.1 | 0.091526082 | 0.208327863 |
| STOP_OVER_IN | 0.1 | 0.526665234 | 0.194793414 |
| ms | 0.3 | 0.121978734 | 0.172932687 |
The last validation experiment was done for Isolation Forest (ISF) unsupervised method. Because we have already labelled data we can run the unsupervised method and see if it identifies the correct anomalies. Of course, Isolation Forest is not able to distinguish between distinct types of anomalies. It can mark events as normal or anomalous however, this is enough to test the ratio of false positives to true positives.
Table 5 shows the performance of Isolation Forest. It shows the total manually labelled anomaly and detected anomalies count, the number of false positives and good anomalies detected. Percentage labelled denotes the percentage of anomalies from the original data set, percentage detected denotes the percentage of ISF detected anomalies. This shows that although ISF didn’t detect all the anomalies (15.5 % from the original 22.4 %) it had a relatively small false positive count (58 anomalies yielding an accuracy of 93.4%). During the testing phase, it was evident that the more data you feed to ISF the more accurate it becomes. We tested the method with only 6500 events. It is possible to reduce the error significantly by adding more events.
Table 4: Performance of Isolation Forest.
| Metric | CEP |
|---|---|
| Labelled Anomalies | 1447 |
| Detected Anomalies | 999 |
| False Positives | 58 |
| Good Anomalies | 941 |
| Percentage Labelled | 22.4 |
| Percentage Detected | 15.5 |
| Accuracy | 93.4 |
Results
During this period, the anomaly detection tool has been validated to detect anomalies related with the cost execution time of the different events that the CEP component analyses, this cost impact directly in the performance of the system. The ISF method did not detect all the anomalies (15.5 % from the original 22.4 %) but it had a relatively small false positive count (accuracy of 93.4%). It is possible in increase the accuracy of the method by considering a bigger set of data. We achieved quality KPI “False Positives”, by having a 6.6% of false positives using the anomaly detection tool.
Ismael Torres Boigues, Prodevelop
Christophe Joubert, Prodevelop
Gabriel Iuhasz, IeAT
Sorry, the comment form is closed at this time.